The range however is wide, from less than a month to more than 6 years. Much depends on who is building the house, for what purpose, and where.
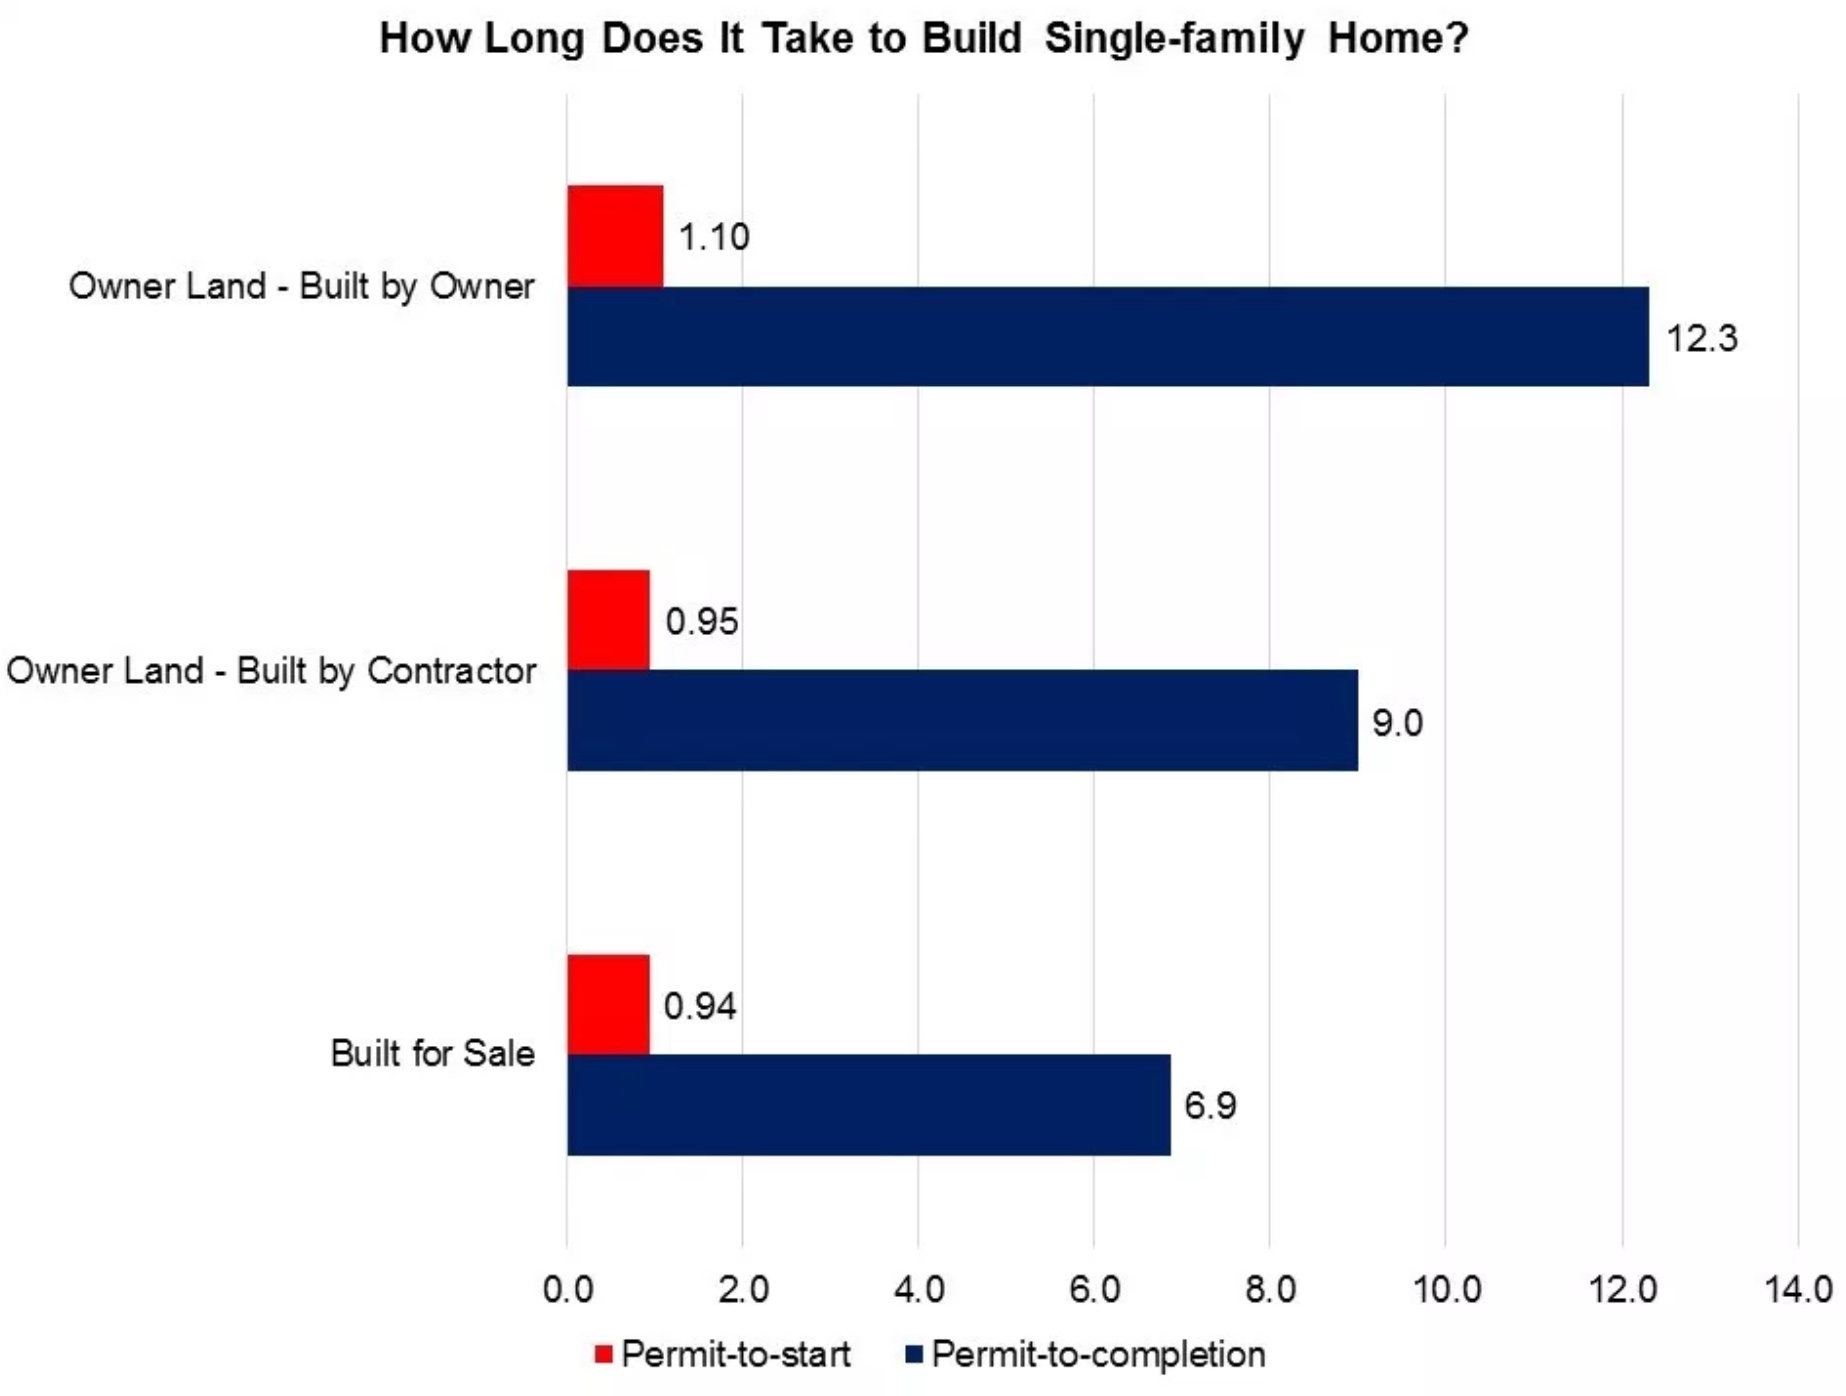
, writing in NAHB’s Eye on Housing Blog, says that houses built for sale took the shortest time in 2017, 6.9 months from permit to completion while houses built by owners acting as their own general contractors took 12.3 months. Homes built by hired contractors were in the middle at around 9 months. Where homes were being built for sale or were custom homes built by contractors on the owner’s land, construction typically began within a month after the permit was pulled while owners overseeing their own construction had a one-month lag.

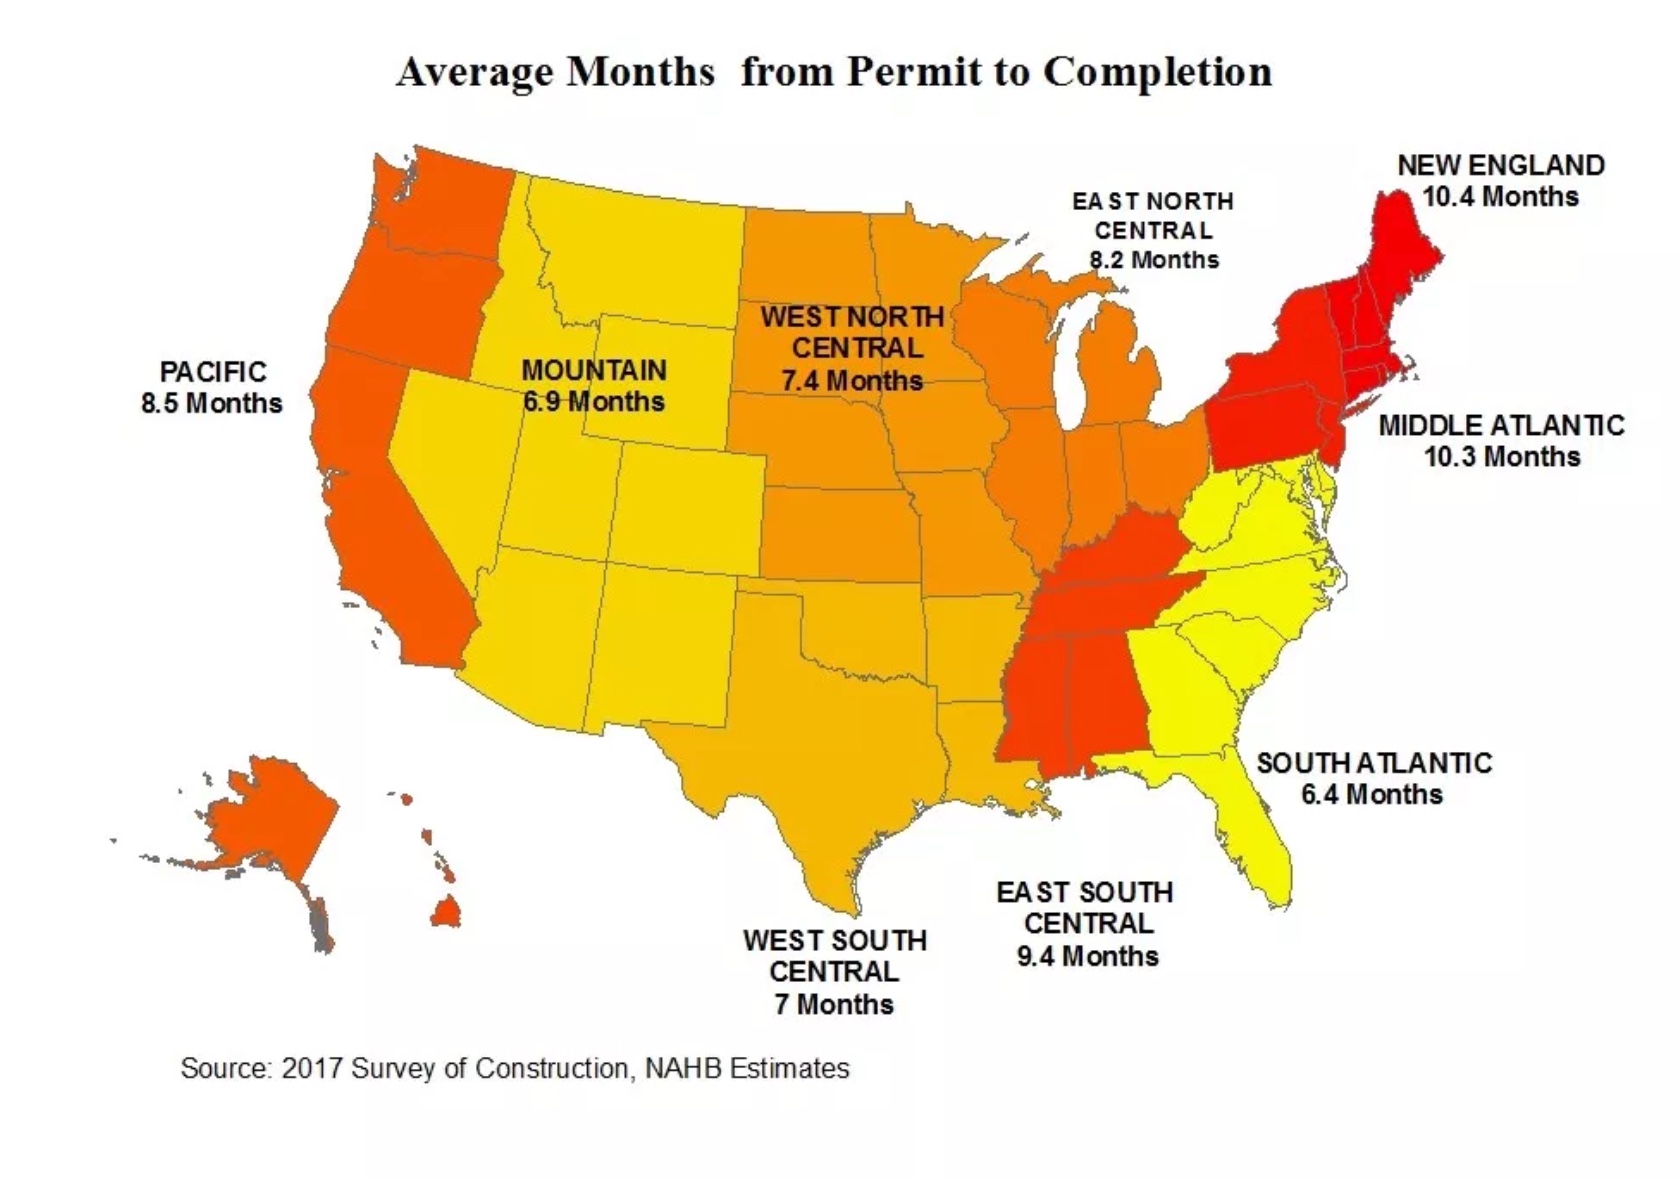
It took the longest to build a home in the New England division, 10.4 months, followed closely by the Middle Atlantic at 10.3 months. The East South Central, East North Central, and Pacific divisions also exceeded the 7.5-month national average. The shortest period, 6.4 months, was in the South Atlantic division. As to permits, the lag before construction started ranged from 17 days in the Mountain division to 39 days in the Pacific.

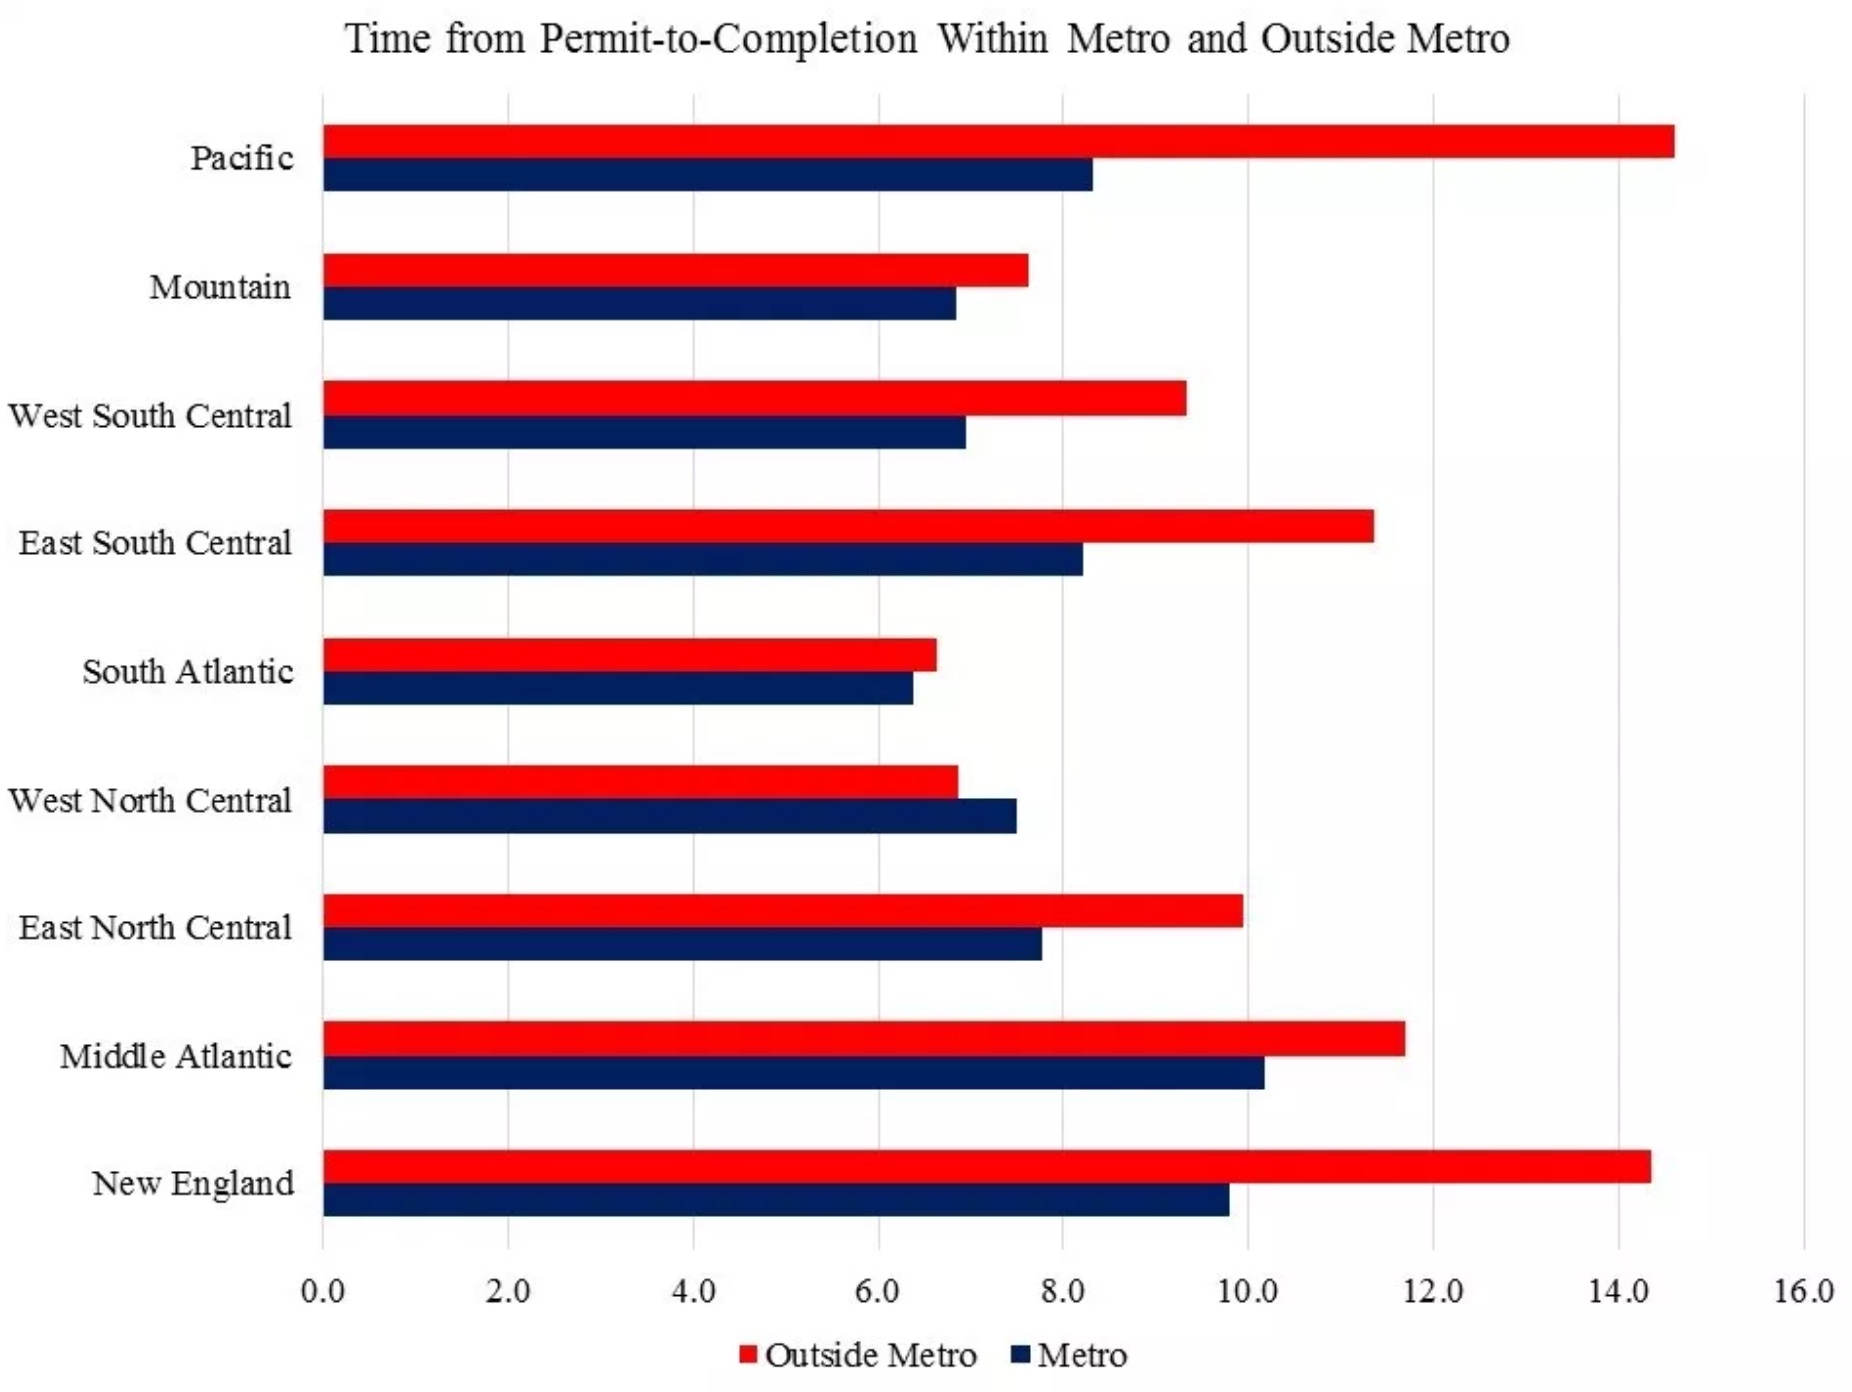
The total building time was considerably shorter inside than outside metropolitan areas, a pattern that held in all census divisions but the West North Central division. Some of the location differences were striking; with construction outside metro areas taking more than a third longer in New England and the Pacific.

The SOC also collects sale information for houses built for sale, including the sale date when buyers sign the sale contracts or make a deposit. Looking at single-family homes completed in 2017, 31.6 percent of homes were sold before construction started, 28.8 percent while under construction, 11.3 percent within a month of completion, and 16.6 percent sold after completion. The percent of single-family houses completed in 2017 and remaining unsold as of the first quarter of 2018 was 11.6 percent.
